Real estate activity for the 1st quarter of 2019 across the Southern Georgian Bay region has shown some improvement from the slowdown we experienced in the latter half of 2018 with stronger sales in specific portions of the market particularly in the higher price segments.
MLS® dollar sales in both January and February were at increased levels from the same time last year but softened slightly in March with sales for the month of $87.6 million down 5.2% from March 2018. Despite softer sales in March, total 1st quarter residential dollar sales through the MLS® system of the Southern Georgian Bay Association of REALTORS® (SGBAR) totalled $201.9 million, an increase of $12.9 million or 6.8% more than the 1st quarter of 2018. Once again it is worth noting that these results are for residential MLS® sales only including single family homes, condominiums and vacant lots. Commercial properties, farms etc. are excluded as are sales of new homes made directly by developers outside of the local MLS® system.
While year-to-date MLS® dollar sales have increased over the first three months of 2018, unit sales in 2019 through the end of March are below last year, down just over 10%. It is hard to say what effect the severe winter weather had on the unit volume in the first quarter. Anecdotally, at the brokerage, we had a significant number of days where the number of showings that were being cancelled due to weather far outstripped the new showings being requested. How- ever, a great ski season can also have a positive impact on the market with may Ontarians developing an insatiable need to be on the hills when the snow is great and therefore potentially having a positive impact on the market in the coming quarters.
Year-to-date MLS® single family home sales across our market total 278 units a decrease of 5 homes or 1.7% less than the first three months of 2018. At the same time, we are seeing stronger single-family home sales in some area municipalities around the region.
MLS® home sales in Collingwood total 66 properties up 34.6% while sales in the Blue Mountains of 48 homes is up a modest 6.6% from one year ago. All other area municipalities have year-to-date single-family home sales that are close to or slightly below the 1st quarter of 2018.
While overall year-to-date MLS® dollar volume through the end of March is ahead of last year and unit sales are down, certain price levels are showing some significant gains from one year ago, partic- ularly in the higher price segments of the market. Sales in these upper price ranges is what is driving total MLS® dollar sales making up for the shortfall in unit sales. Sales in the $500,000 to $799,999 range are up 28.5% from one year ago. Sales from $1 million to $1.5 mil- lion are up just slightly over last year. However, we saw a significant percentage jump in the category between $1.5 to $2 million with 8 units sold which is four times greater than the two properties sold in the first three months of last year.

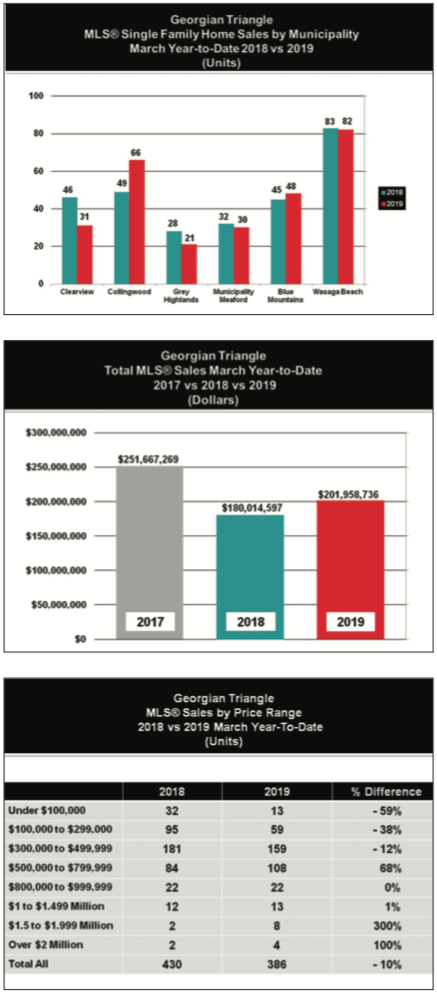
Similarly, sales over $2 million have doubled with 4 MLS® sales reported versus just 2 sold at this time last year. These numbers clearly reflect a strengthening in the luxury market, particularly in the Blue Mountains where almost 50% of sales above $750,000 in our market area take place.

Sales in the lower price segments of our market con- tinue to remain weaker than last year particularly in the $100,000 to $500,000 price ranges. First, it is important to note that properties in the lower end of this category are becoming rarer and rarer. Sales under $100,000 in the 1st quarter of 2018 totalled 32 units whereas this year there we only saw 13. During the first three months of 2018 there were 181 MLS® sales in the $300,000 to $500,000 price category. This year the number has dropped 12.1% to a total of 159 properties sold. Scarcity is likely at play here and we are seeing a fair number of multiple offer situations as a result. One property that was listed just over $200,000 in the northeast part of our trading area attracted a staggering 30 offers!

MLS® condominium sales during the 1st quarter total 68 units, a decrease of 23.5% from the first three months of 2018. Some of this decrease may be attributable to a significant number of new condominium units being built and sold in the area by developers which are not sold through the local MLS® system. We do expect inventory to strengthen in the second quarter as is normal after the winter market.

Overall, we continue to experience a general shortfall of inventory listed for sale on our local MLS® system. Year- to-date, the number of new listings for residential properties totals 674 units which is a modest 3.3% increase above the number of new residential listings that came to market in the 1st quarter of 2018. While demand still exceeds supply, properties listed for sale are lingering on the market a touch longer before selling. For the 1st quarter of 2019, days on market have increased to 56 from 47 last year. The only exception to the inventory shortage is in the upper price ranges of the market where inventory remains stronger. The level of MLS® listed inventory overall however is showing signs of trending upwards, which is encouraging for those looking to buy. This may push the market closer to balance if inventory continues to strengthen.

Bring on Spring!!! |E|