 One of the cornerstones of this Market Watch has always been (and likely will always be) data. As discussed in my last installment, data used to be a cornerstone of our value proposition, but is increasingly becoming open source.
But this is only one dimension of data. We are getting to a point where we can use data not just to predict market value, and establish trends, but help you choose a neighbourhood that is right for you today, and maybe even in the future.
Royal LePage just announced a new tool called “Your Perfect Life”. In partnership with the data giant Environics they have taken demographic data from neighbourhoods across the country and created a fun and in- teractive tool that can help you know more about the neighbourhood in which you live. Just enter your postal code and Voila…average in- come, average age, average age of kids in that neighbourhood, and tons of other interesting data. It even categorizes residents of a given area into pithy and slightly humorous categories. Are you a “Classy Commuter”? Are you “Young and Restless”? How about “Affluent Influencer” or “Hometown Proud”?
And this is where it gets cool—it can even be used as a tool for you to pick a neighbourhood you might want to buy in, based on where you see yourself in the future. Let’s say you just started a new job and are thinking of starting a family. You can tell the system that in 5 years you see yourself with 3 kids, an income of 100k, and want a neighbourhood primarily populated by couples of the same age and stage that have the same job category as you do. The system takes this info and will make neighbourhood recommendations based on where you see your- self in that perfect future life.
So much for boring old data. Technology is increasingly allowing us to reinvent data and its utility to the consuming public.
And that is important because of how people are shopping. The National Association of REALTORS (NAR) continually tracks consumer trends in real estate. A recent report from NAR indicates that 100% of consumers are now using the internet to help them with their search for real estate. 87% are using a REALTOR to help them with their search (up from 69% in 2003). It goes on to note that 40% of consumers looking at real estate online have a 120-day lag time between doing re- search and taking action. New data interpretation and usage such as “Your Perfect Life” is becoming more and more critical to online engagement and providing real value to the consumer. (By the way, the irony of using data to justify the new and improved use of data is not lost on me.)
And now… let’s look at the data.
For our purposes, when we talk about percentage increases and decreases,inventory and list to sold ratios,we useMLS® data. But what is MLS® data?
Let’s start with MLS® Systems. The Canadian Real Estate Association states that MLS® Systems are cooperative selling systems operated by real estate®Boards and Associations in Canada. They are accessible to REALTOR Members of those Boards and Associations who have agreed to represent your interests and share remuneration from the transaction with a cooperating REALTOR® Member. MLS® Systems contain detailed information and numerous search tools, all designed to match people with the properties that fit their exact requirements.
This is not to be confused with REALTOR.CA® (what the public used to call MLS® ) which is, essentially, an advertising site for real estate in Canada.
The data that we use to generate our market reports and this market watch comes from our MLS® System. Most properties that are listed with a REALTOR® are typically listed on our MLS® system. Through this, we can track listed, expired and sold data, days on market, geographic areas, property types, size, bedroom count and any number of relevant data sets. These data sets are undoubtedly the most comprehensive available and, when correctly interpreted, can be a tremendous indica- tor of the market in general and assist us in doing our jobs in helping individual clients.
It is not the only data available to us however. We also use services that you are likely familiar with such as MPAC (Municipal Property Assessment Corporation) and some you may never have heard of such as Teranet. ®
While the data provided to us through our MLS® system is impressive, it sometimes lacks critical components due to its very nature. Since it is a sharing service, it needs input from the participants. The definition of market price is the price that a willing Buyer will pay to a willing seller, free of duress and with adequate time exposed®to the market. What if a piece of real estate trades without a REALTOR® ,or if the data we need is older than our records? That is where Teranet comes in.
Teranet is an electronic version of what the old land registry offices used to be. A repository of much of the critical information on individual real property in Ontario. Who owns it? Historical information including previous owners and sale prices. Mortgage and lien information. We use this data to round out the edges of the other data available to us and fill in the gaps.
 The Market:
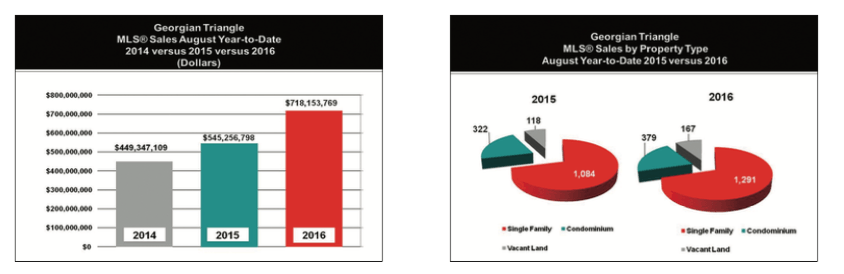
Area real estate sales through the end of August continue at a record pace with no signs of a pending slow down. Year-to-date MLS® unit sales as reported by the Southern Georgian Bay Association of REAL- TORS (SGBAR) for the first eight months of 2016 now total 1,946 properties, an increase of 22% over the prior last year. MLS® dollar volume for the year now stands at $718.2 million a 32% increase over the first 8 months of 2015. Back in 2008 when the southern Georgian Bay market and others were in the depths of the global recession, total MLS® dollar volume for the entire year totalled just under $500 million. Now just 8 years later we might very well see local MLS® sales exceed $1 billion in 2016.
In most real estate markets across Canada, MLS sales are far outpacing the inventory of MLS® listed properties. New MLS® listings year-to- date in our local market area through Au®gust total 3,025 properties which is 7% below the number of new MLS listings that came to market in the same period last year. A 22%increase in MLS® sales combined with a 7% decrease in new MLS® listings has helped propel our market into one which very much favours sellers. During 2016 we have seen an unprecedented number of listed properties garner multiple offers with some selling for well over the asking price.
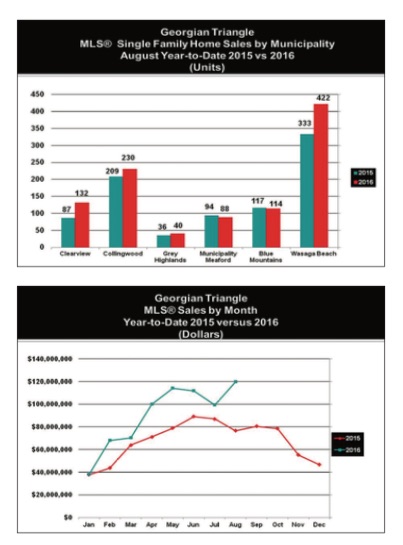
MLS® sales of single family homes year-to-date total 1,291 homes, an increase of 19% over 2015. Similarly, area condominium sales are also very strong in 2016 with 379 sales representing an 18% increase over 2015. After several years of lacklustre sales, there has been a strong resurgence in vacant land sales. Year-to-date through the end of August there have been 167 vacant lot sales compared to 118 in the first eight months of last year, a healthy increase of 42%. No doubt the shortage of MLS® listed homes for sale has helped propel vacant land sales with buyers resorting to building versus buying an existing home.
Virtually every municipality in our market area has seen year-over-year increases in single family home, cottage or chalet sales.
Somewhat surprisingly, Clearview Township continues to lead all area municipalities in terms of the largest increase in single family home sales year-over-year with 149 sales through the end of August representing a 43% increase over 2015. Single family home sales in Wasaga Beach are up 29% this year with 486 MLS® sales reported. Sales of single family homes in Collingwood are up 15% through the end of August while sales in the Municipalities of Meaford and Grey Highlands are up 9% and 20% respectively. Lastly MLS® single family home sales in the Blue Mountains are up a modest 8% with 149 sales reported.
With these last few months remaining in 2016, we have every reason to remain bullish about area real estate sales. With another ski season soon to be upon us, area condo and chalet sales are sure to escalate with the only real threat to sales being an inadequate level of listed properties for sale.


